Nuclear magnetic resonance spectroscopy, NMR spectroscopy- a spectroscopic method for studying chemical objects, using the phenomenon of nuclear magnetic resonance. The NMR phenomenon was discovered in 1946 by American physicists F. Bloch and E. Purcell. The most important for chemistry and practical applications are proton magnetic resonance spectroscopy (PMR spectroscopy), as well as carbon-13 NMR spectroscopy ( 13 C NMR spectroscopy), fluorine-19 ( 19 F NMR spectroscopy), phosphorus-31 ( 31 P NMR spectroscopy). If an element has an odd atomic number or an isotope of any (even even) element has an odd mass number, the nucleus of such an element has a spin other than zero. From the excited state to the normal state, the nuclei can return, transferring the excitation energy to the environment - the “lattice”, which in this case means electrons or atoms of a different sort than those under study. This energy transfer mechanism is called spin-lattice relaxation, and its efficiency can be characterized by a constant T1, called the spin-lattice relaxation time.
These features make NMR spectroscopy a convenient tool both in theoretical organic chemistry and in the analysis of biological objects.
Basic NMR technique
A sample of a substance for NMR is placed in a thin-walled glass tube (ampoule). When placed in a magnetic field, NMR active nuclei (such as 1 H or 13 C) absorb electromagnetic energy. The resonant frequency, absorption energy and intensity of the emitted signal are proportional to the strength of the magnetic field. So, in a field of 21 Tesla, a proton resonates at a frequency of 900 MHz.
chemical shift
Depending on the local electronic environment, different protons in a molecule resonate at slightly different frequencies. Since both this frequency shift and the fundamental resonant frequency are directly proportional to the magnitude of the magnetic field induction, this shift is converted into a dimensionless quantity independent of the magnetic field, known as the chemical shift. Chemical shift is defined as a relative change relative to some reference samples. The frequency shift is extremely small compared to the main NMR frequency. A typical frequency shift is 100 Hz, while the base NMR frequency is on the order of 100 MHz. Thus, chemical shift is often expressed in parts per million (ppm). In order to detect such a small frequency difference, the applied magnetic field must be constant within the sample volume.
Since the chemical shift depends on the chemical structure of the substance, it is used to obtain structural information about the molecules in the sample. For example, the spectrum for ethanol (CH 3 CH 2 OH) gives 3 distinctive signals, that is, 3 chemical shifts: one for the CH 3 group, the second for the CH 2 group and the last for OH. A typical shift for a CH 3 group is about 1 ppm, for a CH 2 group attached to OH is 4 ppm and OH is about 2-3 ppm.
Due to molecular motion at room temperature, the signals of the 3 methyl protons average out during the NMR process, which lasts only a few milliseconds. These protons degenerate and form peaks at the same chemical shift. The software allows you to analyze the size of the peaks in order to understand how many protons contribute to these peaks.
Spin-spin interaction
The most useful information for determining the structure in a one-dimensional NMR spectrum is provided by the so-called spin-spin interaction between active NMR nuclei. This interaction results from transitions between different nuclear spin states in chemical molecules, resulting in splitting of NMR signals. This splitting can be simple or complex and, as a result, is either easy to interpret or can confuse the experimenter.
This binding provides detailed information about the bonds of atoms in a molecule.
Second order interaction (strong)
The simple spin-spin interaction assumes that the coupling constant is small compared to the difference in chemical shifts between the signals. If the shift difference decreases (or the coupling constant increases), the intensity of the sample multiplets becomes distorted, becoming more difficult to analyze (especially if the system contains more than 2 spins). However, in high-power NMR spectrometers, distortion is usually moderate, and this makes it easy to interpret the associated peaks.
The second order effects decrease with increasing frequency difference between the multiplets, so the high frequency NMR spectrum shows less distortion than the low frequency spectrum.
Application of NMR spectroscopy to the study of proteins
Most of the recent innovations in NMR spectroscopy are made in the so-called protein NMR spectroscopy, which is becoming a very important technique in modern biology and medicine. A common goal is to obtain a high resolution 3-dimensional structure of a protein, similar to images obtained in X-ray crystallography. Due to the presence of more atoms in a protein molecule compared to a simple organic compound, the underlying 1 H spectrum is overflowing with overlapping signals, making direct spectrum analysis impossible. Therefore, multidimensional techniques have been developed to solve this problem.
To improve the results of these experiments, the labeled atom method using 13 C or 15 N is used. In this way, it becomes possible to obtain a 3D spectrum of a protein sample, which has become a breakthrough in modern pharmaceuticals. Recently, techniques (having both advantages and disadvantages) for obtaining 4D spectra and spectra of higher dimensions, based on nonlinear sampling methods with subsequent restoration of the free induction decay signal using special mathematical techniques, have become widespread.
Quantitative analysis by NMR
In the quantitative analysis of solutions, peak area can be used as a measure of concentration in the calibration curve method or the addition method. Methods are also known in which a graduated graph reflects the concentration dependence of the chemical shift. The use of the NMR method in inorganic analysis is based on the fact that in the presence of paramagnetic substances, the nuclear relaxation time is accelerated. Measurement of the relaxation rate can be performed by several methods. Reliable and versatile, for example, is the impulsive version of the NMR method, or, as it is usually called, the spin echo method. In measurements using this method, short-term radio-frequency pulses are applied to the sample under study in a magnetic field at certain time intervals in the region of resonant absorption. A spin echo signal appears in the receiving coil, the maximum amplitude of which is related to the relaxation time by a simple relation. It is not necessary to find the absolute values of the relaxation rates to carry out the usual analytical determinations. In these cases, one can confine oneself to measuring some quantity proportional to them, for example, the amplitude of the resonant absorption signal. Amplitude measurement can be done with simple, more affordable equipment. A significant advantage of the NMR method is a wide range of measured parameter values. Using the spin echo setting, you can determine the relaxation time from 0.00001 to 100 s. with an error of 3...5%. This allows you to determine the concentration of the solution in a very wide range from 1 ... 2 to 0.000001 ... 0000001 mol / l. The most commonly used analytical technique is the calibration curve method.
Nuclear magnetic resonance spectroscopy is one of the most common and very sensitive methods for determining the structure of organic compounds, which makes it possible to obtain information not only on the qualitative and quantitative composition, but also on the arrangement of atoms relative to each other. In various NMR techniques, there are many possibilities for determining the chemical structure of substances, the confirmation states of molecules, the effects of mutual influence, and intramolecular transformations.
The method of nuclear magnetic resonance has a number of distinctive features: unlike optical molecular spectra, the absorption of electromagnetic radiation by a substance occurs in a strong uniform external magnetic field. Moreover, to conduct an NMR study, the experiment must meet a number of conditions that reflect the general principles of NMR spectroscopy:
1) recording of NMR spectra is possible only for atomic nuclei with their own magnetic moment or the so-called magnetic nuclei, in which the number of protons and neutrons is such that the mass number of isotope nuclei is odd. All nuclei with an odd mass number have spin I, the value of which is 1/2. So for the nuclei 1 H, 13 C, l 5 N, 19 F, 31 P the spin value is 1/2, for the nuclei 7 Li, 23 Na, 39 K and 4 l R - the spin is 3/2. Nuclei with an even mass number either have no spin at all if the nuclear charge is even, or have integer spin values if the charge is odd. Only those nuclei whose spin is I 0 can give an NMR spectrum.
The presence of spin is associated with the circulation of an atomic charge around the nucleus, therefore, a magnetic moment arises μ . A rotating charge (for example, a proton) with an angular momentum J creates a magnetic moment μ=γ*J . The angular nuclear moment J and the magnetic moment μ arising during rotation can be represented as vectors. Their constant ratio is called the gyromagnetic ratio γ. It is this constant that determines the resonant frequency of the nucleus (Fig. 1.1).

Figure 1.1 - A rotating charge with an angular momentum J creates a magnetic moment μ=γ*J .
2) the NMR method investigates the absorption or emission of energy under unusual conditions for the formation of the spectrum: in contrast to other spectral methods. The NMR spectrum is recorded from a substance in a strong uniform magnetic field. Such nuclei in an external field have different values of potential energy depending on several possible (quantized) orientation angles of the vector μ relative to the vector of the external magnetic field strength H 0 . In the absence of an external magnetic field, the magnetic moments or spins of nuclei do not have a definite orientation. If magnetic nuclei with spin 1/2 are placed in a magnetic field, then part of the nuclear spins will be located parallel to the magnetic field lines, the other part will be antiparallel. These two orientations are no longer energetically equivalent and the spins are said to be distributed over two energy levels.
Spins with a magnetic moment oriented along the +1/2 field are denoted by the symbol | α >, with orientation antiparallel to the external field -1/2 - symbol | β > (Fig. 1.2) .
Figure 1.2 - The formation of energy levels when an external field H 0 is applied.
1.2.1 NMR spectroscopy on 1 H nuclei. Parameters of the PMR spectra.
To interpret the data of 1H NMR spectra and assign signals, the main characteristics of the spectra are used: chemical shift, spin-spin interaction constant, integrated signal intensity, and signal width [57].
A) Chemical shift (X.C). H.S. scale Chemical shift is the distance between this signal and the signal of the reference substance, expressed in parts per million of the magnitude of the external field strength.
Tetramethylsilane [TMS, Si(CH 3) 4 ] containing 12 structurally equivalent strongly screened protons is most often used as a standard for measuring the chemical shifts of protons.
B) Spin-spin interaction constant. Signal splitting is observed in high-resolution NMR spectra. This splitting or fine structure in high-resolution spectra results from the spin-spin interaction between magnetic nuclei. This phenomenon, along with the chemical shift, is the most important source of information about the structure of complex organic molecules and the distribution of the electron cloud in them. It does not depend on H 0 , but depends on the electronic structure of the molecule. The signal of a magnetic nucleus interacting with another magnetic nucleus is split into several lines depending on the number of spin states, i.e. depends on the spins of the nuclei I.
The distance between these lines characterizes the energy of the spin-spin bond between the nuclei and is called the spin-spin coupling constant n J, where n is the number of bonds that separate the interacting nuclei.
There are direct constants J HH , geminal constants 2 J HH , vicinal constants 3 J HH and some distant constants 4 J HH , 5J HH .
- geminal constants 2 J HH can be both positive and negative and occupy the range from -30Hz to +40Hz.
The vicinal constants 3 J HH occupy the range 0–20 Hz; they are almost always positive. It has been established that the vicinal interaction in saturated systems depends very strongly on the angle between carbon-hydrogen bonds, that is, on the dihedral angle - (Fig. 1.3).

Figure 1.3 - Dihedral angle φ between carbon-hydrogen bonds.
Long-range spin-spin interaction (4 J HH , 5J HH ) - the interaction of two nuclei separated by four or more bonds; the constants of such interaction are usually from 0 to +3 Hz.
Table 1.1 - Spin-spin interaction constants
C) Integral signal intensity. The signal area is proportional to the number of magnetic nuclei resonating at a given field strength, so the signal area ratio gives the relative number of protons of each structural variety and is called the integrated signal intensity. Modern spectrometers use special integrators, the readings of which are recorded as a curve, the height of the steps of which is proportional to the area of the corresponding signals.
D) Line width. To characterize the line width, it is customary to measure the width at a distance of half the height from the zero line of the spectrum. The experimentally observed linewidth is the sum of the natural linewidth, which depends on the structure and mobility, and the broadening due to instrumental reasons
The usual line width in PMR is 0.1-0.3 Hz, but it can increase due to the overlap of adjacent transitions, which do not exactly match, but are not resolved as separate lines. Broadening is possible in the presence of nuclei with a spin greater than 1/2 and chemical exchange.
1.2.2 Application of 1 H NMR data to establish the structure of organic molecules.
When solving a number of problems of structural analysis, in addition to tables of empirical values, Kh.S. it may be useful to quantify the effects of neighboring substituents on C.C. by the rule of additivity of effective screening contributions. In this case, substituents that are removed from a given proton by no more than 2-3 bonds are usually taken into account, and the calculation is carried out according to the formula:
δ=δ 0 +ε i *δ i (3)
where δ 0 is the chemical shift of protons of the standard group;
δ i is the substituent screening contribution.
1.3 13 C NMR spectroscopy. Acquisition and recording modes of spectra.
The first reports on the observation of 13C NMR appeared in 1957, however, the transformation of 13C NMR spectroscopy into a practically used method of analytical research became much later.
Magnetic resonance 13 C and 1 H have much in common, but there are also significant differences. The most common isotope of carbon 12 C has I=0. The 13 C isotope has I=1/2, but its natural abundance is 1.1%. This is along with the fact that the gyromagnetic ratio of 13 C nuclei is 1/4 of the gyromagnetic ratio for protons. This reduces the sensitivity of the method in experiments on the observation of 13 C NMR by 6000 times compared to 1 H nuclei.
a) without suppression of the spin-spin interaction with protons. The 13C NMR spectra obtained in the absence of complete suppression of spin-spin resonance with protons were called high-resolution spectra. These spectra contain complete information about the constants 13 C - 1 H . In relatively simple molecules, both types of constants - forward and far - are found quite simply. So 1 J (С-Н) is 125 - 250 Hz, however, spin-spin interaction can also occur with more distant protons with constants less than 20 Hz.
b) complete suppression of the spin-spin interaction with protons. The first major progress in the field of 13C NMR spectroscopy is associated with the use of complete suppression of the spin-spin interaction with protons. The use of complete suppression of the spin-spin interaction with protons leads to the merging of multiplets with the formation of singlet lines if there are no other magnetic nuclei such as 19 F and 31 P in the molecule.
c) incomplete suppression of the spin-spin interaction with protons. However, the use of the mode of complete decoupling from protons has its drawbacks. Since all carbon signals are now in the form of singlets, all information about the 13C-1H spin-spin interaction constants is lost. part of the benefits of broadband connectivity. In this case, the spectra will show splittings due to the direct constants of the 13C-1H spin-spin interaction. This procedure makes it possible to detect signals from non-protonated carbon atoms, since the latter do not have protons directly bound to 13C and appear in the spectra with incomplete decoupling from protons as singlets.
d) modulation of the C-H interaction constant, JMODCH spectrum. A traditional problem in 13C NMR spectroscopy is to determine the number of protons associated with each carbon atom, i.e., the degree of protonation of the carbon atom. Partial suppression by protons makes it possible to resolve the carbon signal from the multiplicity caused by long-range spin-spin interaction constants and obtain signal splitting due to direct 13C-1H SSCCs. However, in the case of strongly coupled AB spin systems and overlapping of multiplets in the OFFR mode, it makes unambiguous signal resolution difficult.
1. The essence of the phenomenon
First of all, it should be noted that although the word “nuclear” is present in the name of this phenomenon, NMR has nothing to do with nuclear physics and has nothing to do with radioactivity. If we talk about a strict description, then one cannot do without the laws of quantum mechanics. According to these laws, the interaction energy of a magnetic core with an external magnetic field can take only a few discrete values. If magnetic nuclei are irradiated with an alternating magnetic field, the frequency of which corresponds to the difference between these discrete energy levels, expressed in frequency units, then the magnetic nuclei begin to move from one level to another, while absorbing the energy of the alternating field. This is the phenomenon of magnetic resonance. This explanation is formally correct, but not very clear. There is another explanation, without quantum mechanics. The magnetic core can be thought of as an electrically charged ball rotating around its axis (although, strictly speaking, this is not the case). According to the laws of electrodynamics, the rotation of a charge leads to the appearance of a magnetic field, i.e., the magnetic moment of the nucleus, which is directed along the axis of rotation. If this magnetic moment is placed in a constant external field, then the vector of this moment begins to precess, i.e., rotate around the direction of the external field. In the same way, the spinning wheel axis precesses (rotates) around the vertical, if it is unwound not strictly vertically, but at a certain angle. In this case, the role of the magnetic field is played by the gravitational force.
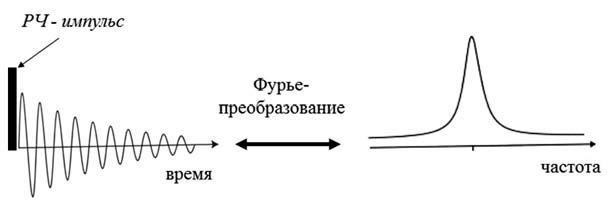
The precession frequency is determined both by the properties of the nucleus and by the strength of the magnetic field: the stronger the field, the higher the frequency. Then, if, in addition to a constant external magnetic field, an alternating magnetic field acts on the nucleus, then the nucleus begins to interact with this field - it, as it were, swings the nucleus more strongly, the precession amplitude increases, and the nucleus absorbs the energy of the alternating field. However, this will occur only under the condition of resonance, i.e., the coincidence of the precession frequency and the frequency of the external alternating field. It looks like a classic example from school physics - soldiers marching across the bridge. If the step frequency coincides with the natural frequency of the bridge, then the bridge sways more and more. Experimentally, this phenomenon manifests itself in the dependence of the absorption of an alternating field on its frequency. At the moment of resonance, the absorption increases sharply, and the simplest magnetic resonance spectrum looks like this:

2. Fourier spectroscopy
The first NMR spectrometers worked exactly as described above - the sample was placed in a constant magnetic field, and RF radiation was continuously applied to it. Then either the frequency of the alternating field or the intensity of the constant magnetic field changed smoothly. The energy absorption of the alternating field was recorded by a radio frequency bridge, the signal from which was output to a recorder or an oscilloscope. But this method of signal registration has not been used for a long time. In modern NMR spectrometers, the spectrum is recorded using pulses. The magnetic moments of the nuclei are excited by a short powerful pulse, after which a signal is recorded, which is induced in the RF coil by freely precessing magnetic moments. This signal gradually decreases to zero as the magnetic moments return to equilibrium (this process is called magnetic relaxation). The NMR spectrum is obtained from this signal using a Fourier transform. This is a standard mathematical procedure that allows you to decompose any signal into frequency harmonics and thus obtain the frequency spectrum of this signal. This method of recording the spectrum allows you to significantly reduce the noise level and conduct experiments much faster.
One excitation pulse to record the spectrum is the simplest NMR experiment. However, there can be many such pulses, of different duration, amplitude, with different delays between them, etc., in the experiment, depending on what kind of manipulations the researcher needs to carry out with the system of nuclear magnetic moments. However, almost all of these pulse sequences end in the same thing - recording a free precession signal followed by a Fourier transform.
3. Magnetic interactions in matter
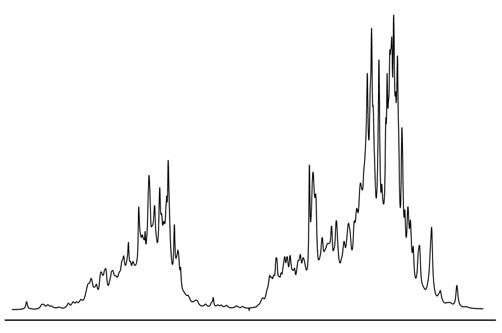
In itself, magnetic resonance would remain nothing more than an interesting physical phenomenon, if it were not for the magnetic interactions of nuclei with each other and with the electron shell of the molecule. These interactions affect the resonance parameters, and with their help, the NMR method can be used to obtain various information about the properties of molecules - their orientation, spatial structure (conformation), intermolecular interactions, chemical exchange, rotational and translational dynamics. Thanks to this, NMR has become a very powerful tool for studying substances at the molecular level, which is widely used not only in physics, but mainly in chemistry and molecular biology. An example of one of these interactions is the so-called chemical shift. Its essence is as follows: the electron shell of the molecule responds to an external magnetic field and tries to screen it - partial screening of the magnetic field occurs in all diamagnetic substances. This means that the magnetic field in the molecule will differ from the external magnetic field by a very small amount, which is called the chemical shift. However, the properties of the electron shell in different parts of the molecule are different, and the chemical shift is also different. Accordingly, the resonance conditions for nuclei in different parts of the molecule will also differ. This makes it possible to distinguish chemically nonequivalent nuclei in the spectrum. For example, if we take the spectrum of hydrogen nuclei (protons) of pure water, then there will be only one line in it, since both protons in the H 2 O molecule are exactly the same. But for methyl alcohol CH 3 OH there will already be two lines in the spectrum (if other magnetic interactions are neglected), since there are two types of protons - protons of the methyl group CH 3 and a proton associated with an oxygen atom. As the molecules become more complex, the number of lines will increase, and if we take such a large and complex molecule as a protein, then in this case the spectrum will look something like this:
4. Magnetic cores
NMR can be observed on different nuclei, but it must be said that not all nuclei have a magnetic moment. It often happens that some isotopes have a magnetic moment, while other isotopes of the same nucleus do not. In total, there are more than a hundred isotopes of various chemical elements that have magnetic nuclei, but no more than 1520 magnetic nuclei are usually used in research, everything else is exotic. Each nucleus has its own characteristic ratio of the magnetic field and the precession frequency, called the gyromagnetic ratio. For all nuclei these ratios are known. Using them, one can choose the frequency at which, for a given magnetic field, a signal from the nuclei needed by the researcher will be observed.
The most important nuclei for NMR are protons. They are most abundant in nature, and they have a very high sensitivity. For chemistry and biology, the nuclei of carbon, nitrogen and oxygen are very important, but scientists were not very lucky with them: the most common isotopes of carbon and oxygen, 12 C and 16 O, do not have a magnetic moment, the natural nitrogen isotope 14N has a moment, but it a number of reasons for experiments is very inconvenient. There are 13 C, 15 N and 17 O isotopes that are suitable for NMR experiments, but their natural abundance is very low and the sensitivity is very low compared to protons. Therefore, special isotopically enriched samples are often prepared for NMR studies, in which the natural isotope of one or another nucleus is replaced by the one needed for experiments. In most cases, this procedure is very difficult and expensive, but sometimes it is the only way to get the necessary information.
5. Electron paramagnetic and quadrupole resonance
Speaking of NMR, one cannot fail to mention two other related physical phenomena - electron paramagnetic resonance (EPR) and nuclear quadrupole resonance (NQR). EPR is essentially similar to NMR, the difference lies in the fact that the resonance is observed on the magnetic moments not of atomic nuclei, but of the electron shell of the atom. EPR can be observed only in those molecules or chemical groups whose electron shell contains the so-called unpaired electron, then the shell has a non-zero magnetic moment. Such substances are called paramagnets. EPR, like NMR, is also used to study various structural and dynamic properties of substances at the molecular level, but its scope is much narrower. This is mainly due to the fact that most molecules, especially in living nature, do not contain unpaired electrons. In some cases, it is possible to use a so-called paramagnetic probe, i.e. a chemical group with an unpaired electron that binds to the molecule under study. But this approach has obvious drawbacks that limit the possibilities of this method. In addition, in EPR there is no such high spectral resolution (i.e., the ability to distinguish one line from another in the spectrum) as in NMR.
It is most difficult to explain the nature of NQR "on the fingers". Some nuclei have a so-called electric quadrupole moment. This moment characterizes the deviation of the distribution of the electric charge of the nucleus from spherical symmetry. The interaction of this moment with the gradient of the electric field created by the crystalline structure of the substance leads to the splitting of the energy levels of the nucleus. In this case, resonance can be observed at a frequency corresponding to transitions between these levels. Unlike NMR and EPR, NQR does not require an external magnetic field, since level splitting occurs without it. NQR is also used to study substances, but its scope is even narrower than that of EPR.
6. Advantages and disadvantages of NMR
NMR is the most powerful and informative method for studying molecules. Strictly speaking, this is not one method, but a large number of different types of experiments, i.e., pulse sequences. Although they are all based on the NMR phenomenon, but each of these experiments is designed to obtain some specific specific information. The number of these experiments is measured by many tens, if not hundreds. Theoretically, NMR can, if not everything, then almost everything that all other experimental methods for studying the structure and dynamics of molecules can, although in practice this is, of course, far from always feasible. One of the main advantages of NMR is that, on the one hand, its natural probes, i.e., magnetic nuclei, are distributed throughout the molecule, and, on the other hand, it makes it possible to distinguish these nuclei from each other and obtain spatially selective data on properties of the molecule. Almost all other methods provide information either averaged over the entire molecule, or only about one of its parts.
There are two main disadvantages of NMR. First, this is a low sensitivity compared to most other experimental methods (optical spectroscopy, fluorescence, EPR, etc.). This leads to the fact that in order to average the noise, the signal must be accumulated for a long time. In some cases, the NMR experiment can be carried out for even several weeks. Secondly, it is its high cost. NMR spectrometers are among the most expensive scientific instruments, costing at least hundreds of thousands of dollars, with the most expensive spectrometers costing several million. Not all laboratories, especially in Russia, can afford to have such scientific equipment.

7. Magnets for NMR spectrometers
One of the most important and expensive parts of a spectrometer is the magnet, which creates a constant magnetic field. The stronger the field, the higher the sensitivity and spectral resolution, so scientists and engineers are constantly trying to get the highest possible fields. The magnetic field is created by an electric current in the solenoid - the stronger the current, the greater the field. However, it is impossible to increase the current indefinitely; at a very high current, the solenoid wire will simply begin to melt. Therefore, superconducting magnets, i.e., magnets in which the solenoid wire is in the superconducting state, have been used for a very long time for high-field NMR spectrometers. In this case, the electrical resistance of the wire is zero, and no energy is released at any current value. The superconducting state can only be obtained at very low temperatures, just a few degrees Kelvin - this is the temperature of liquid helium. (High-temperature superconductivity is still the lot of purely fundamental research.) It is with the maintenance of such a low temperature that all the technical difficulties in the design and production of magnets are connected, which cause their high cost. The superconducting magnet is built on the principle of a thermos matryoshka. The solenoid is in the center, in the vacuum chamber. It is surrounded by a shell containing liquid helium. This shell is surrounded by a shell of liquid nitrogen through a vacuum layer. The temperature of liquid nitrogen is minus 196 degrees Celsius, nitrogen is needed so that helium evaporates as slowly as possible. Finally, the nitrogen shell is isolated from room temperature by an outer vacuum layer. Such a system is able to maintain the desired temperature of the superconducting magnet for a very long time, although this requires regular pouring of liquid nitrogen and helium into the magnet. The advantage of such magnets, in addition to the ability to obtain high magnetic fields, is also that they do not consume energy: after the start of the magnet, the current runs through the superconducting wires with virtually no loss for many years.
8. Tomography
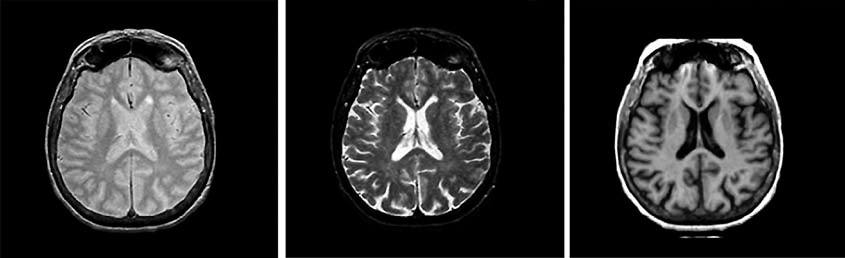
In conventional NMR spectrometers, they try to make the magnetic field as uniform as possible, this is necessary to improve the spectral resolution. But if the magnetic field inside the sample, on the contrary, is made very inhomogeneous, this opens up fundamentally new possibilities for using NMR. The inhomogeneity of the field is created by the so-called gradient coils, which are paired with the main magnet. In this case, the magnitude of the magnetic field in different parts of the sample will be different, which means that the NMR signal can be observed not from the entire sample, as in a conventional spectrometer, but only from its narrow layer, for which resonance conditions are met, i.e., the desired ratio of magnetic field and frequency. By changing the magnitude of the magnetic field (or, which is essentially the same thing, the frequency of observing the signal), you can change the layer that will give the signal. Thus, it is possible to "scan" the sample throughout its volume and "see" its internal three-dimensional structure without destroying the sample in any mechanical way. To date, a large number of techniques have been developed that make it possible to measure various NMR parameters (spectral characteristics, magnetic relaxation times, self-diffusion rate, and some others) with spatial resolution inside a sample. The most interesting and important, from a practical point of view, the use of NMR tomography was found in medicine. In this case, the "sample" being examined is the human body. NMR imaging is one of the most effective and safe (but also expensive) diagnostic tools in various fields of medicine, from oncology to obstetrics. It is curious to note that doctors do not use the word "nuclear" in the name of this method, because some patients associate it with nuclear reactions and the atomic bomb.

9. History of discovery
The year of the discovery of NMR is considered to be 1945, when the Americans Felix Bloch from Stanford and independently Edward Parcell and Robert Pound from Harvard first observed the NMR signal on protons. By that time, much was already known about the nature of nuclear magnetism, the NMR effect itself was theoretically predicted, and several attempts were made to observe it experimentally. It is important to note that a year earlier in the Soviet Union, in Kazan, the EPR phenomenon was discovered by Evgeny Zavoisky. It is now well known that Zavoisky also observed the NMR signal, this was before the war, in 1941. However, he had a poor quality magnet with poor field uniformity at his disposal, the results were poorly reproducible and therefore remained unpublished. In fairness, it should be noted that Zavoisky was not the only one who observed NMR before its "official" discovery. In particular, the American physicist Isidore Rabi (Nobel Prize winner in 1944 for the study of the magnetic properties of nuclei in atomic and molecular beams) also observed NMR in the late 1930s, but considered this to be an instrumental artifact. One way or another, but our country remains a priority in the experimental detection of magnetic resonance. Although Zavoisky himself soon after the war began to deal with other problems, his discovery for the development of science in Kazan played a huge role. Kazan is still one of the world's leading research centers for EPR spectroscopy.
10. Nobel Prizes in Magnetic Resonance
In the first half of the 20th century, several Nobel Prizes were awarded to scientists without whose work the discovery of NMR could not have taken place. Among them are Peter Szeeman, Otto Stern, Isidor Rabi, Wolfgang Pauli. But there were four Nobel Prizes directly related to NMR. In 1952, Felix Bloch and Edward Purcell received the prize for the discovery of NMR. This is the only "NMR" Nobel Prize in physics. In 1991, the Swiss Richard Ernst, who worked at the famous ETH Zurich, won the Chemistry Prize. He was awarded it for the development of multidimensional NMR spectroscopy methods, which made it possible to radically increase the information content of NMR experiments. In 2002, the prize winner, also in chemistry, was Kurt Wüthrich, who worked with Ernst in neighboring buildings at the same Technical School. He received the award for developing methods for determining the three-dimensional structure of proteins in solution. Prior to this, the only method that allowed determining the spatial conformation of large biomacromolecules was only X-ray diffraction analysis. Finally, in 2003, the American Paul Lauterbur and the Englishman Peter Mansfield received the Medical Prize for the invention of NMR imaging. The Soviet discoverer of the EPR E.K. Zavoisky, alas, did not receive the Nobel Prize.
The essence of the NMR phenomenon can be illustrated as follows. If a nucleus with a magnetic moment is placed in a uniform field 0 directed along the z axis, then its energy (with respect to the energy in the absence of a field) is equal to -mzH0, where mz is the projection of the nuclear magnetic moment onto the direction of the field.
As already noted, the nucleus can be in 2I + 1 states. In the absence of an external field 0, all these states have the same energy. If we denote the largest measurable value of the magnetic moment component by m, then all measurable values of the magnetic moment component (in this case, mz) are expressed as mm, where m is the quantum number, which, as is known, can take the values
m=I,I–1,I–2,…,-(I+1),-I.
Since the distance between the energy levels corresponding to each of the 2I + 1 states is equal to mH0 / I, then the nucleus with spin I has discrete energy levels:
MH0,-(I–1)/ImH0,…(I–1)/ImH0,mH0.
The splitting of energy levels in a magnetic field can be called nuclear Zeeman splitting, since it is similar to the splitting of electronic levels in a magnetic field (the Zeeman effect). Zeeman splitting for a system with I = 1 (with three energy levels).
The NMR phenomenon consists in the resonant absorption of electromagnetic energy due to the magnetism of the nuclei. This implies the obvious name of the phenomenon: nuclear - we are talking about a system of nuclei, magnetic - we mean only their magnetic properties, resonance - the phenomenon itself is resonant in nature. Indeed, it follows from the Bohr frequency rules that the frequency n of the electromagnetic field causing transitions between adjacent levels is determined by the formula:
hν=μH0/I, or ν=μH0/hI.
Since the vectors of the angular momentum (angular momentum) and the magnetic momentum are parallel, it is often convenient to characterize the magnetic properties of nuclei by the value g defined by the relation
where γ is the gyromagnetic ratio having the dimension radian*oersted-1*second-1 (rad*Oe-1*s-1). With this in mind, we find
ν=γ0/2π. (3.2)
Thus, the frequency is proportional to the applied field.
If, as a typical example, we take the value of $\gamma$ for a proton equal to 2.6753*104 rad/(E*s) and H0 = 10000 Oe, then the resonant frequency
ν=42.577 (MHz)
Such a frequency can be generated by conventional radio techniques.
NMR spectroscopy is characterized by a number of features that distinguish it from other analytical methods. About half ($\sim$150) of the nuclei of known isotopes have magnetic moments, but only a minority of them are systematically used.
Prior to the advent of pulsed spectrometers, most studies were carried out using the phenomenon of NMR on hydrogen nuclei (protons) 1H (proton magnetic resonance - PMR) and fluorine 19F. These nuclei have ideal properties for NMR spectroscopy:
high natural content of the "magnetic" isotope (1H 99.98%, 19F 100%); for comparison, it can be mentioned that the natural content of the "magnetic" carbon isotope 13C is 1.1%; large magnetic moment; spin I = 1/2.
This determines, first of all, the high sensitivity of the method in detecting signals from the nuclei mentioned above. In addition, there is a theoretically rigorously substantiated rule according to which only nuclei with a spin equal to or greater than unity have an electric quadrupole moment. Consequently, 1H and 19F NMR experiments are not complicated by the interaction of the nuclear quadrupole moment of the nucleus with the electrical environment.
The introduction of pulsed NMR spectrometers into everyday practice has significantly expanded the experimental possibilities of this type of spectroscopy. In particular, the recording of 13C NMR spectra of solutions - the most important isotope for chemistry - is now actually a familiar procedure. The detection of signals from nuclei, the intensity of NMR signals of which is many times lower than the intensity of signals from 1H, including those in the solid phase, has also become a common phenomenon.
High-resolution NMR spectra usually consist of narrow, well-resolved lines (signals) corresponding to magnetic nuclei in various chemical environments. The intensities (areas) of the signals during the recording of the spectra are proportional to the number of magnetic nuclei in each group, which makes it possible to carry out a quantitative analysis using NMR spectra without preliminary calibration.
Another feature of NMR is the effect of exchange processes involving resonating nuclei on the position and width of resonant signals. Thus, NMR spectra can be used to study the nature of such processes. NMR lines in liquid spectra typically have a width of 0.1 - 1 Hz (high-resolution NMR), while the same nuclei examined in the solid phase will give rise to lines with a width of the order of 1 * 104 Hz (hence the concept of NMR wide lines ).
In high-resolution NMR spectroscopy, there are two main sources of information about the structure and dynamics of molecules:
chemical shift; spin-spin interaction constants.
Under real conditions, resonating nuclei whose NMR signals are detected are a constituent of atoms or molecules. When the substances under study are placed in a magnetic field (0), a diamagnetic moment of atoms (molecules) arises due to the orbital motion of electrons. This movement of electrons forms effective currents and, therefore, creates a secondary magnetic field proportional to the field 0 in accordance with Lenz's law and oppositely directed. This secondary field acts on the nucleus. Thus, the local field in the place where the resonating nucleus is, loc=0 (3.3)
where σ is a dimensionless constant called the screening constant and does not depend on 0, but strongly depends on the chemical (electronic) environment; it characterizes the decrease in lok compared to 0 .
The value of $\sigma$ varies from a value of the order of 10-5 for a proton to values of the order of 10-2 for heavy nuclei. Taking into account the expression for lok, we have: ν=γΗ0(1−σ)/2π (3.4)
The screening effect is to reduce the distance between the levels of nuclear magnetic energy, or, in other words, leads to the convergence of the Zeeman levels. In this case, the energy quanta that cause transitions between levels become smaller and, consequently, resonance sets in at lower frequencies (see expression (3.4)). If the experiment is carried out by changing the field 0 until resonance sets in, then the strength of the applied field should have a large value compared to the case when the core is not shielded.
Influence of electronic shielding on Zeeman levels of the nucleus: a - unshielded, b - shielded
In the vast majority of NMR spectrometers, spectra are recorded when the field changes from left to right, so the signals (peaks) of the most shielded nuclei should be in the right part of the spectrum.
The shift of the signal depending on the chemical environment, due to the difference in screening constants, is called the chemical shift.
For the first time, messages about the discovery of a chemical shift appeared in several publications in 1950-1951. Among them, it is necessary to highlight the work of Arnold, who obtained the first spectrum with separate lines corresponding to chemically different positions of identical 1H nuclei in one molecule.
There are three types of protons in this molecule: three protons of the methyl group CH3-, two protons of the methylene group -CH2- and one proton of the hydroxyl group -OH. It can be seen that three separate signals correspond to three types of protons. Since the intensity of the signals is in the ratio 3: 2: 1, the decoding of the spectrum (assignment of signals) is not difficult.
Since chemical shifts cannot be measured on an absolute scale, that is, relative to a nucleus devoid of all its electrons, the signal of a reference compound is used as a conditional zero. Usually, chemical shift values for any nuclei are given as a dimensionless parameter δ defined as follows:
δ=(H−Het)/Het*106, (3.6)
where (H - Nat) is the difference between the chemical shifts for the test sample and the reference, Nat is the absolute position of the reference signal with the applied field (H0) .
In real experimental conditions, it is possible to measure the frequency more accurately than the field, so $\delta$ is usually found from the expression:
δ=(ν−νet)/ν0*106, (3.7)
where (ν – νet) is the difference between the chemical shifts for the sample and the standard, expressed in units of frequency (Hz); NMR spectra are usually calibrated in these units.
You should use not ν0 - the working frequency of the spectrometer (it is usually fixed), but the frequency νet, that is, the absolute frequency at which the resonant signal of the standard is observed. However, the error introduced by such a replacement is very small, since ν0 and νet are almost equal (the difference is 10-5, that is, by the value of σ for a proton). Since different NMR spectrometers operate at different frequencies ν0 (and, consequently, at different fields H0), it is obvious that δ must be expressed in dimensionless units.
The unit of chemical shift is one millionth of the field strength or resonant frequency. Spin-spin interaction.
In 1951-1953, when recording the NMR spectra of a number of liquids, it was found that the spectra of some substances contain more lines than follows from a simple estimate of the number of nonequivalent nuclei. One of the first examples is the resonance on fluorine in the POCl2F molecule. The 19F spectrum consists of two lines of equal intensity, although there is only one fluorine atom in the molecule. Molecules of other compounds gave symmetrical multiplet signals (triplets, quartets, etc.).
This interaction is due to the mechanism of indirect communication through the electronic environment. The nuclear spin tends to orient the spins of the electrons surrounding the given nucleus. Those, in turn, orient the spins of other electrons and through them - the spins of other nuclei. The energy of the spin-spin interaction is usually expressed in hertz (that is, the Planck constant is taken as a unit of energy, based on the fact that E=hν). It is clear that there is no need (unlike the chemical shift) to express it in relative units, since the discussed interaction, as noted above, does not depend on the strength of the external field. The magnitude of the interaction can be determined by measuring the distance between the components of the corresponding multiplet.
The simplest example of splitting due to spin-spin coupling that can be encountered is the resonance spectrum of a molecule containing two kinds of magnetic nuclei A and X. The nuclei A and X can be either different nuclei or nuclei of the same isotope (for example, 1H ) when the chemical shifts between their resonant signals are large.
Spin echo methods.
In experiments, when a high-frequency field 1 acts continuously on a sample in a uniform magnetic field 0, a stationary state is reached, in which two opposite tendencies are mutually compensated. On the one hand, under the action of a high-frequency field 1, the occupation numbers of the Zeeman levels tend to equalize, which leads to demagnetization of the system, and on the other hand, thermal motion prevents this and restores the Boltzmann distribution.
Completely different unsteady processes are observed when the high-frequency field 1 is turned on for a short time. The practical implementation of experiments of this kind is possible, since the characteristic time parameters of the electronic equipment are small compared to the decay time of the Larmor precession T2.
For the first time, the reaction of a system to pulses of a high-frequency field was observed by Khan in 1950, having discovered the phenomenon - spin echo. This discovery marked the beginning of the development of pulsed NMR techniques.
The action of field 1, rotating at a resonant frequency, is reduced to a deviation of the magnetization from the initial equilibrium direction parallel to field 0. If the field is turned on only for a short period of time, and then turned off again, then the angle of deviation of the magnetization vector depends on the pulse duration. After field 1 is turned on, the magnetization vector will precess around field 0 until its components perpendicular to field 0 disappear, either due to relaxation or due to other causes. The inductive signal that is observed after turning off the high-frequency field 1 is the damping of free precession, first considered by Bloch.
If the strength of field 1 is high and the duration of the pulse tw is so short that relaxation processes can be neglected during the pulse, then the action of field 1 will be reduced to a rotation of the magnetization vector by an angle g1tw (g1 is the angular velocity with which field 1 deviates the vector from the z axis ). If the values 1 and tw are chosen in such a way that g1tw=1/2p, (3.8) then the vector after rotation will be in the xy plane. Such pulses are called 900 turn pulses (or 900th pulses). Those pulses for which g1tw=p are called 1800 turn pulses (1800th pulses).
The action of the last pulses on the magnetization vector leads to a change in its initial direction to the opposite. The effect of 900-th pulses can be better understood by considering them in a coordinate system rotating with an angular velocity equal to the frequency of field 1. If the pulse duration is short, so that the final result depends little on the magnitude of the deviation of the field 1 frequency from the resonant value, then in such a system coordinates, the magnetization vector M immediately after the end of the pulse action will be directed along the v axis.
If the constant field 0 is completely uniform, then the behavior of the magnetization vector after the end of the pulse is determined only by relaxation processes. Therefore, the component of the magnetization vector located in the plane perpendicular to field 0 will rotate around this direction with the Larmor frequency, while its amplitude will tend to zero according to the law exp(-t/T2).
In the case when the inhomogeneity of the magnetic field H0 cannot be neglected, the attenuation occurs faster. This phenomenon can be visualized using a series of diagrams showing the position of the vector on the
magnetization in different parts of the sample at certain moments of the damping process. Let us assume that the sample is divided into several regions, and within each region the magnetic field is uniform, and the magnetization is characterized by its own vector i. The presence of a magnetic field inhomogeneity 0 will lead to the fact that instead of the precession of the resulting magnetization vector with a certain Larmor frequency w0, there will be a precession of a set of magnetization vectors with frequencies distributed according to a certain law.
Let us consider the motion of these vectors in a coordinate system rotating with an angular velocity equal to the average velocity of the Larmor precession corresponding to some average value of the field H0. Vectors i are called spin isochromats.
However, due to the fact that they have different precession rates, since are in regions of the pattern with different field values of 0, then some of them will rotate faster and some will rotate slower than the coordinate system. Therefore, in a coordinate system rotating with a certain average angular velocity, spin isochromates will scatter into a “fan”. Because the receiving coil of the induction system responds only to the vector sum of these moments, then signal attenuation is observed.
Hahn found that the impact on the system of the second pulse after a time interval τ after the first one leads to the appearance of an echo signal after an equal time interval 2τ. The echo signal is observed even when the free precession signal is completely attenuated within 2τ.
1. Initially, the system is in thermal equilibrium, and all magnetization vectors are parallel to the constant field 0.
2. Under the influence of a high-frequency field directed along the x΄ axis of the rotating coordinate system, the magnetization vectors during the first pulse deviate from the direction of the z axis to the direction of the y΄ axis.
3. After the end of the 900th pulse, all magnetization vectors are located in the equatorial plane in the direction of the y΄ axis (the vector product is a vector perpendicular in this case to the z΄x΄ plane). If the pulse duration tω is sufficiently small, then no relaxation or scattering of the magnetization vectors into a "fan", associated with the inhomogeneity of the field 0, will be observed.
4. Immediately after switching on the high-frequency field H1, the free precession decays, which leads to the scattering of spin isochromats into a "fan" located in the x΄y΄ plane.
5. After a time interval τ, an 1800-th pulse with a duration of 2tω acts on the system. As a result of this impulse, the entire system of vectors i rotates by 1800 around the x΄ axis.
6. At the end of the second pulse, each of the magnetization vectors in the rotating coordinate system continues to move in the same direction. However, now, after turning by 1800, this movement does not lead to scattering, but to the folding of the ″fan″ of vectors.
7. After a time interval of 2τ after the start of the first pulse, all magnetization vectors located in the x΄y΄ plane will have the same direction and will create a strong resulting magnetic moment in the negative direction of the y΄ axis. This leads to a pickup in the receiving coil of a signal called an echo.
8. After the appearance of the echo signal, the magnetization vectors again scatter into a "fan", and the usual damping of the free precession is observed. The decay of the echo signal (beginning from the time 2τ) coincides in form with the decay of the free induction signal after the first 900th pulse. Immediately after the 1800th pulse, no signal of free induction occurs.
The shape of the echo signal, as well as the shape of the free precession damping signal, depends on the time law, which obeys the spreading of the magnetization vector into a "fan". If the magnetic field is non-uniform, then coherence is lost quickly and the echo will be narrow; its width is of order (γΔΗ0)-1. Thus, the spin echo mechanism eliminates the usual undesirable effect of the inhomogeneity of a stationary magnetic field.
If the molecules remain for a long time in the same parts of the sample, then the amplitude of the echo signal is determined only by relaxation processes and, therefore, is proportional to exp(-2τ/T2). However, in liquids and gases, diffusion processes can not always be neglected. Therefore, due to the movement of molecules in an inhomogeneous magnetic field, the rate of dispersion into a "fan" of some magnetization vectors changes.
As a result, there is some additional loss of coherence. In this case, the amplitude of the echo signal turns out to be dependent on τ as follows:
exp[–2τ/T2 –k(2τ)3/3]. (3.9)
For echoes received for a sequence of 900 and 1800 pulses
k=1/4γ2GD , (3.10)
where D is the diffusion constant;
G is the average value of the magnetic field gradient (dH0/dt)av.
If the condition is met
12/γ2G2D<< T32, (3.11)
then the main role in the attenuation of spin echo signals will be played by diffusion processes rather than relaxation processes. Similar phenomena are also observed for any other pulses, and not only for a sequence of 900 and 1800 pulses. If a sequence of 900th pulses is applied, then after the second pulse there is a decay signal of free precession, which is absent when using a sequence of 900th and 1800th pulses. This is because after time τ, due to the action of the spin-lattice relaxation mechanism, the magnetic moment directed along the z axis is partially restored. This process can be characterized by the function:
f=1 – exp (–τ/T1). (3.12)
As a result, the impact of the second 900th pulse leads to a free precession decay signal, the amplitude of which is f times less than the amplitude of the first signal. In the case when the second pulse is the 1800th pulse, this restoring magnetic moment will be directed in the negative direction of the z axis and, therefore, its projection on the xy plane is zero.
Spin echo experiments can be carried out with a large number of pulses. There are general calculation methods. Suitable for any pulse train.
If the sample contains nuclei with different resonant frequencies and spin-spin interaction takes place between them, then the spin echo pattern becomes more complicated. In this case, the dependence of the attenuation of the amplitude of the spin echo signal on the interval between pulses τ does not obey the law (3.9), but also contains some terms oscillating in time. Now let us dwell on how it is possible to control the phase of the alternating voltage of the second pulse so that in the rotating coordinate system the field 1 is again directed along the +x΄ axis, as in the case of the first pulse. The fact is that in the so-called coherent equipment, a highly stable frequency generator produces a stationary alternating voltage, which enters the power amplifier through a key circuit.
The key circuitry passes the RF signal (field 1) and it is amplified only during the period of time when these circuits are opened by the strobe pulse. Thus, the powerful RF pulses at the output of the amplifier coincide in time with the gate pulses. The output voltage of the amplifier is applied to the sample coil in which an RF field is created 1. If the generator frequency ω is finely tuned to resonance, i.e. ω=ω0, then the phase of this field is always the same in a coordinate system rotating with frequency ω0.
NMR spectrometers.
The NMR spectrometer must contain the following main elements:
1) a magnet that creates a magnetic field 0 polarizing the nuclear spin - system;
2) a transmitter that creates a probing field 1;
3) a sensor in which, under the influence of 0 and 1, an NMR signal appears in the sample;
4) a receiver that amplifies this signal;
5) recording system (recorder, magnetic recording, oscilloscope, etc.);
6) information processing devices (integrator, multichannel spectrum accumulator);
7) a system for stabilizing resonance conditions;
8) sample temperature control system;
9) a transmitter that creates field 2 for double resonances;
10) programming system for NMR registration: for a spin-spectrometer - a sweep of the field 0 or frequency n0 in a given interval with the required speed required by the number of spectrum realizations; for pulsed spectrometers – selection of the number, amplitude and duration of probing pulses, the tracking time of each point and the number of points of the interferrogram, the repetition time of the interferrogram, the number of cycles of accumulation of the interferrogram;
11) magnetic field correction systems. This schematic enumeration shows that a modern NMR spectrometer is a complex measuring system.
According to the purpose of NMR - spectrometers are divided into devices of high and low resolution. The boundary here is conditional, and more and more often the characteristics of high and low resolution NMR spectrometers are combined in one universal instrument. A typical low resolution instrument should have a magnet providing a relative resolution of about 10-6 h
To ensure high sensitivity, a modulation method of signal observation is used: field 0 (frequency n0) is modulated according to a sinusoidal law; the frequency nm and the amplitude Am are chosen from considerations of optimizing the sensitivity and the signal distortions introduced by such modulation. Since the spin-lattice relaxation time T1 in crystals can reach several hours, the low-resolution spectrometer must be able to detect NMR at extremely low levels of the radio frequency field 1 to avoid signal saturation. The sensitivity of the modulation method depends on the ratio Am/d, and this ratio for weak signals has to be chosen comparable to unity. But then there is a strong modulation broadening, which must be taken into account when processing signals. Difficulties increase even more if the NMR line has a wide and narrow components - with a single recording it is impossible to correctly convey the ratio of the intensities of these components.
Recently, pulsed methods for detecting broad NMR lines in solids have become increasingly popular, but here their own difficulties arise. In order to excite all transitions in a spin system in the same way, it is necessary to use very short pulses of duration t and £ 1 μs; this requires powerful RF sources. In addition, the time response of the spin system for broad lines (T2~10 μs) decays very quickly; in order to produce a sufficient number of readings in a few microseconds, an analog-to-digital converter with a speed of about 0.1 μs per channel is required.
Great difficulties arise due to the ringing of the circuit in the sensor and the overload of the receiver after a powerful pulse. The advantage of the pulse technology is that in one experiment all parameters of nuclear magnetism in the sample can be determined - moments, line shape and relaxation times. According to the Fourier theorem, large frequencies correspond to small times. Therefore, impulse methods are being developed to analyze phenomena that occur in a negligibly short time after the end of the impulse. They increase the accuracy of determining the highest moments of the NMR line up to n=14.
To implement pulse narrowing (high resolution in a solid state), the number of transmitter pulse channels must be at least four. Powerful pulses are formed in the amplification mode of oscillations created by an accurate master oscillator. The duration of its operation should be large enough to implement the required accuracy of frequency tuning and the phase of the radio-frequency filling of the pulses. In addition, the coherence of the spectrometer allows high frequency synchronous detection to improve sensitivity.
Along with synchronous detection, signal accumulation with the help of multichannel storage devices is very widely used. The stability of NMR - spectrometers provides a long-term unambiguous correspondence of each spectral interval Dn to the number of the storage memory channel.
High-resolution spectrometers are divided into stationary and pulsed spectrometers according to the method of finding the resonance conditions. In stationary spectrometers, the resonance is found by changing (sweeping) one of the parameters (n or 0) while fixing the other. In pulse spectrometers with a constant external field 0, the sample is irradiated with a short high-frequency pulse of duration t and frequency n, i.e. frequency spectrum, the main power of which is in the band n±1/t. In this band, all the corresponding NMR transitions are excited, giving a response - a signal of the decay of free induction. Fourier transform of this signal gives the usual NMR spectrum.
Spectrometers operating in stationary mode consist of the following main units:
A magnet that creates a very uniform field;
Signal sensor containing the test sample and the receiving coil;
A scanner that allows you to change within a small range the main magnetic field according to a certain law;
RF generator operating in the meter range;
RF receiver and amplifier;
Oscilloscope and recording potentiometer for observing and recording spectra.
Sufficiently fast rotation of the sample makes it possible to effectively get rid of the influence of magnetic field gradients 0. This circumstance, due to the continuous growth of the used values of 0, leads to the fact that the achieved relative resolution, measured as the ratio DH/0, where DH is the observed inhomogeneity of the magnetic field, is in interval 10-9 - 10-10. Lines measured in tenths and hundredths of a hertz, whose width is determined by the length of the relaxation time in the liquid (10–20 s), lead to a significant difficulty. Therefore, it may take several hours for a single realization of the spectrum. This imposes very high requirements on the system for stabilizing resonance conditions, which is usually carried out using NMR (for an additional sample - external stabilization or for one of the lines of the sample under study - internal stabilization). The most successful results are obtained with a combination of internal and external stabilization.
NMR spectroscopy
Nuclear magnetic resonance spectroscopy, NMR spectroscopy- a spectroscopic method for studying chemical objects, using the phenomenon of nuclear magnetic resonance. The most important for chemistry and practical applications are proton magnetic resonance spectroscopy (PMR spectroscopy), as well as carbon-13 NMR spectroscopy ( 13 C NMR spectroscopy), fluorine-19 (infrared spectroscopy, NMR reveals information on the molecular structure of chemicals However, it provides more complete information than IS, allowing one to study dynamic processes in a sample - to determine the rate constants of chemical reactions, the value of energy barriers of intramolecular rotation.These features make NMR spectroscopy a convenient tool both in theoretical organic chemistry and for the analysis of biological objects.
Basic NMR technique
A sample of a substance for NMR is placed in a thin-walled glass tube (ampoule). When placed in a magnetic field, NMR active nuclei (such as 1 H or 13 C) absorb electromagnetic energy. The resonant frequency, absorption energy and intensity of the emitted signal are proportional to the strength of the magnetic field. So in a field of 21 Tesla, a proton resonates at a frequency of 900 MHz.
chemical shift
Depending on the local electronic environment, different protons in a molecule resonate at slightly different frequencies. Since both this frequency shift and the fundamental resonant frequency are directly proportional to the strength of the magnetic field, this shift is converted into a magnetic field-independent dimensionless quantity known as the chemical shift. Chemical shift is defined as a relative change relative to some reference samples. The frequency shift is extremely small compared to the main NMR frequency. A typical frequency shift is 100 Hz, while the base NMR frequency is on the order of 100 MHz. Thus the chemical shift is often expressed in parts per million (ppm). In order to detect such a small frequency difference, the applied magnetic field must be constant within the sample volume.
Since the chemical shift depends on the chemical structure of the substance, it is used to obtain structural information about the molecules in the sample. For example, the spectrum for ethanol (CH 3 CH 2 OH) gives 3 distinctive signals, that is, 3 chemical shifts: one for the CH 3 group, the second for the CH 2 group and the last for OH. A typical shift for a CH 3 group is about 1 ppm, for a CH 2 group attached to OH-4 ppm and OH about 2-3 ppm.
Due to molecular motion at room temperature, the signals of the 3 methyl protons average out during the NMR process, which lasts only a few milliseconds. These protons degenerate and form peaks at the same chemical shift. The software allows you to analyze the size of the peaks in order to understand how many protons contribute to these peaks.
Spin-spin interaction
The most useful information for determining the structure in a one-dimensional NMR spectrum is provided by the so-called spin-spin interaction between active NMR nuclei. This interaction results from transitions between different nuclear spin states in chemical molecules, resulting in splitting of NMR signals. This splitting can be simple or complex and, as a result, is either easy to interpret or can confuse the experimenter.
This binding provides detailed information about the bonds of atoms in a molecule.
Second order interaction (strong)
The simple spin-spin interaction assumes that the coupling constant is small compared to the difference in chemical shifts between the signals. If the shift difference decreases (or the coupling constant increases), the intensity of the sample multiplets becomes distorted, becoming more difficult to analyze (especially if the system contains more than 2 spins). However, in high-power NMR spectrometers, distortion is usually moderate, and this makes it easy to interpret the associated peaks.
The second order effects decrease with increasing frequency difference between the multiplets, so the high frequency NMR spectrum shows less distortion than the low frequency spectrum.
Application of NMR spectroscopy to the study of proteins
Most of the recent innovations in NMR spectroscopy are made in the so-called protein NMR spectroscopy, which is becoming a very important technique in modern biology and medicine. A common goal is to obtain a high resolution 3-dimensional structure of a protein, similar to images obtained in X-ray crystallography. Due to the presence of more atoms in a protein molecule compared to a simple organic compound, the underlying 1 D spectrum is overflowing with overlapping signals, making direct spectrum analysis impossible. Therefore, multidimensional techniques have been developed to solve this problem.
To improve the results of these experiments, the labeled atom method is used, using 13 C or 15 N. Thus, it becomes possible to obtain a 3D spectrum of a protein sample, which has become a breakthrough in modern pharmaceuticals. Recently, methods (having both advantages and disadvantages) of obtaining 4D spectra and spectra of higher dimensions, based on nonlinear sampling methods with subsequent restoration of the free induction decay signal using special mathematical techniques, have become widespread.
Literature
- Gunter X. Introduction to the course of NMR spectroscopy. - Per. from English. - M., 1984.
Wikimedia Foundation. 2010 .
See what "NMR spectroscopy" is in other dictionaries:
Nuclear magnetic resonance spectroscopy on carbon nuclei 13, 13C NMR spectroscopy is one of the methods of NMR spectroscopy using nuclei of the 13C carbon isotope. The 13C nucleus has spin 1/2 in the ground state, its content in nature ... ... Wikipedia
Image of the human brain on a medical NMR tomograph Nuclear magnetic resonance (NMR) resonant absorption of electromagnetic energy by a substance containing nuclei with non-zero spin in an external magnetic field, due to reorientation ... ... Wikipedia
NMR spectroscopy
NMR spectroscopy
magnetic resonance spectroscopy- magnetinio branduolių rezonanso spektroskopija statusas T sritis Standartizacija ir metrologija apibrėžtis Spektroskopija, pagrįsta kietųjų, skystųjų ir dujinių medžiagų magnetinio branduolių rezonanso reiškiniu. atitikmenys: engl. NMR… … Penkiakalbis aiskinamasis metrologijos terminų žodynas
nuclear magnetic resonance spectroscopy- branduolinio magnetinio rezonanso spektroskopija statusas T sritis fizika atitikmenys: engl. NMR spectroscopy; nuclear magnetic resonance spectroscopy vok. magnetische Kernresonanzspektroskopie, f; NMR Spektroskopie, f rus. nuclear spectroscopy … Fizikos terminų žodynas
Magnetinio branduolių rezonanso spektroskopija statusas T sritis Standartizacija ir metrologija apibrėžtis Spektroskopija, pagrįsta kietųjų, skystųjų ir dujinių medžiagų magnetinio branduolių rezonanso reiškiniu. atitikmenys: engl. NMR… … Penkiakalbis aiskinamasis metrologijos terminų žodynas
nuclear resonance spectroscopy- branduolinio magnetinio rezonanso spektroskopija statusas T sritis fizika atitikmenys: engl. NMR spectroscopy; nuclear magnetic resonance spectroscopy vok. magnetische Kernresonanzspektroskopie, f; NMR Spektroskopie, f rus. nuclear spectroscopy … Fizikos terminų žodynas
The set of research methods. in VA according to the absorption spectra of their atoms, ions and molecules el. magn. radio waves. Methods of electronic paramagnet belong to R. resonance (EPR), nuclear magn. resonance (NMR), cyclotron resonance, etc ... Natural science. encyclopedic Dictionary
Image of the human brain on a medical NMR tomograph Nuclear magnetic resonance (NMR) resonant absorption or emission of electromagnetic energy by a substance containing nuclei with non-zero spin in an external magnetic field, at a frequency ν ... ... Wikipedia